


网站维护
系统内容更新/升级中


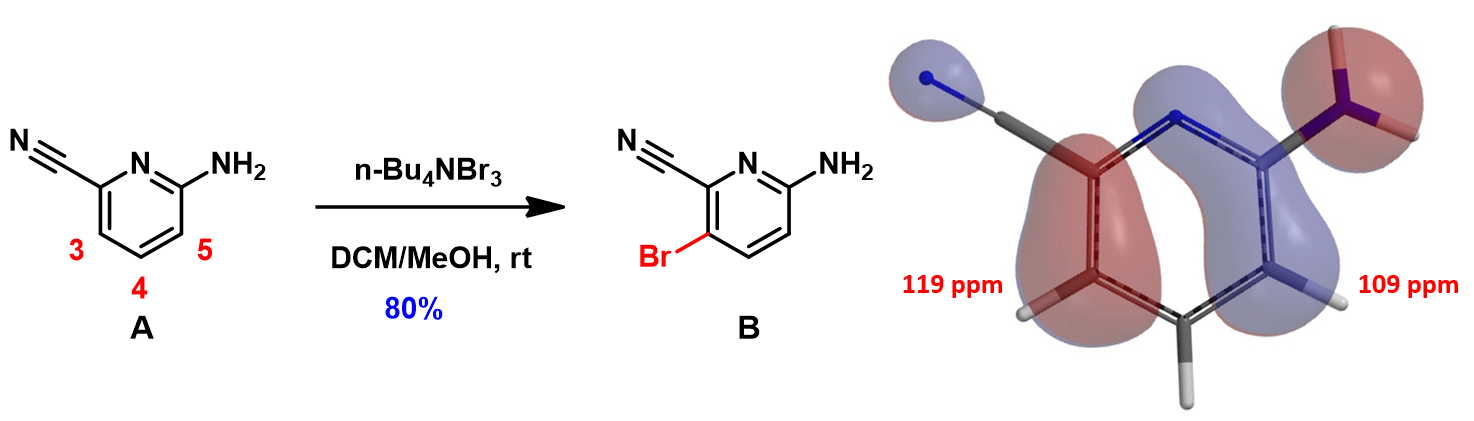
In Chapter 6 of our QM publications, "Stepwise Multiple Halogenation Coupling Reaction Strategies", we discussed the use of tetrabutylammonium tribromide (TBABr3) for a highly para selective bromination of 2-amino-6-cyanopyridine A (Figure 1) [1], overriding the intrinsic bias for ortho substitution, suggestive from its HOMO and calculated 13C chemical shifts. We are interested in understanding the mechanism of this reaction.
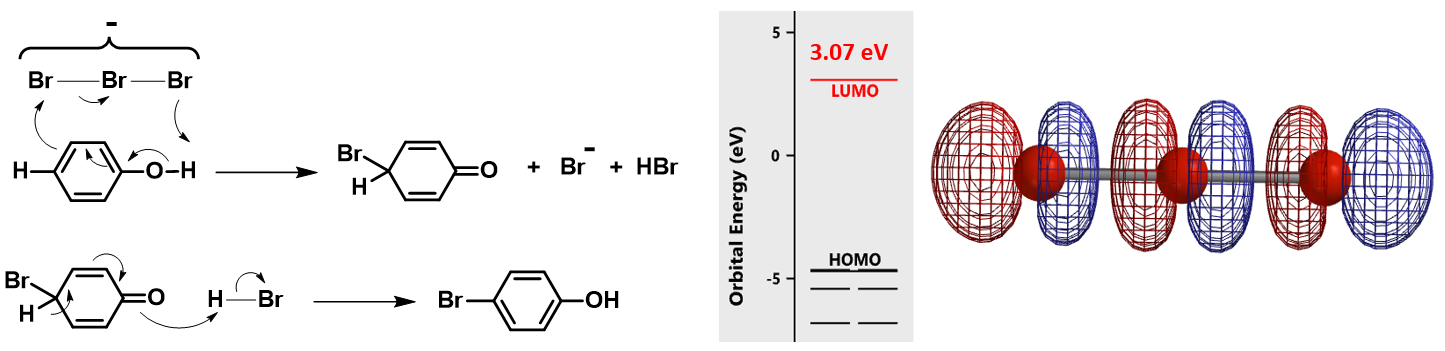
Shown in Figure 2 (left) is the reaction mechanism proposed by Chen & Zhou[2a] for TBABr3 bromination of phenol. It was suggested that free Br3 anion is the brominating species. The reaction involves proton transfer from the phenolic hydroxyl group to tribromide and a series of electron transfers to provide the para bromide selectively. We are intrigued to explore how an electron-rich tribromide anion could react with an electron-rich phenol[2] and calculated for the LUMO of the Br3 anion (Figure 2, right). The LUMO orbital energy is 3.07 eV, too high to be considered as an active brominating species for a room temperature reaction.
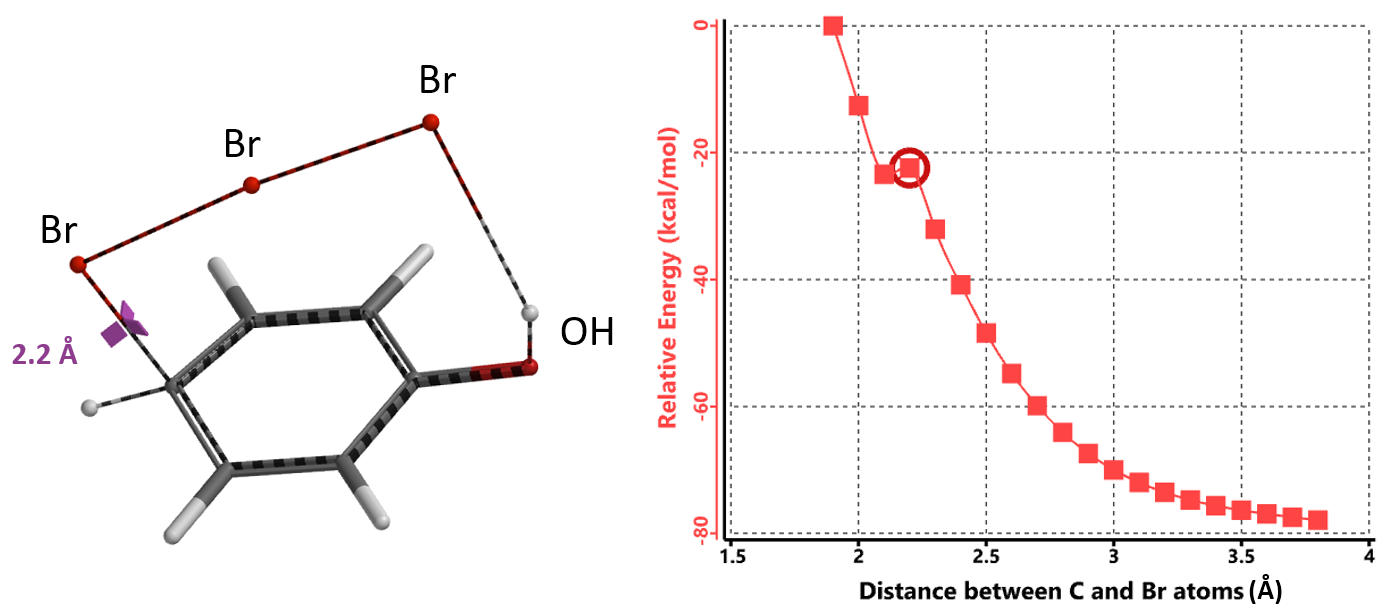
In parallel, we calculated for the reaction energy profile for this proposed mechanism (Figure 3). The C – Br bond distance changes stepwise from 3.8 Å to 1.9 Å; after a small dip at 2.1 Å, energy level continues to increase, casting further doubts that the tribromide anion is the active brominating species.
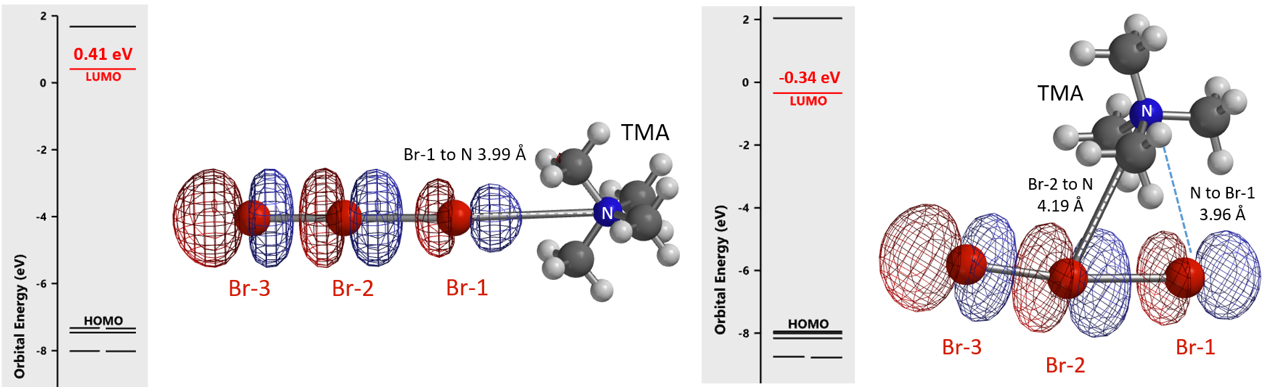
We reasoned that the undissociated TBABr3 is the active bromination species, not the free tribromide anion, and there are two possible ways for the tetrabutylammonium cation and the tribromide anion to be associated. We simplified the tetrabutyl-ammonium cation as tetramethylammonium (TMA) for calculations. LUMO energies of structures with TMA+ attached to Br-1 and Br-2 are 0.41 and -0.34 eV, respectively (Figure 4). The lower the LUMO energy of an electrophile, the more reactive it is expected to be. The calculated equilibrium structure with TMA+ attached to Br-2 is remarkable. The N of TMA+ lies between Br-1 and Br-2, presumably energetically more stable bridging the two bromo atoms, and is actually closer to Br-1 than Br-2 (distances of 3.96 Å and 4.19 Å, respectively). In addition, this TMA–Br-1–Br-2 cyclic structure is 13.42 kcal/mol lower in relative energy than that of the TMA–Br-1 linear structure. Together, these parameters suggest that the cyclic structure is more likely to be the active bromination species.
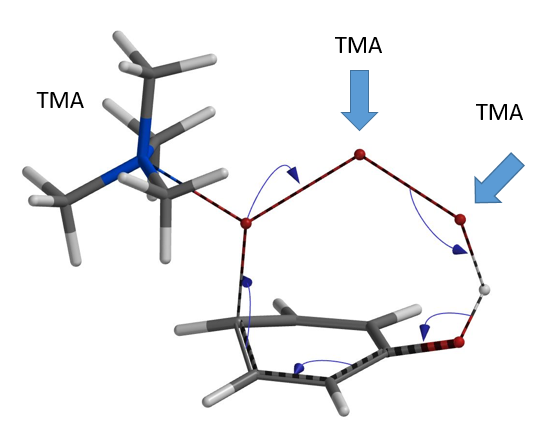
Next we modeled the bromination with TMA+ connecting to the tribromide anion at all three possible positions (Figure 5).
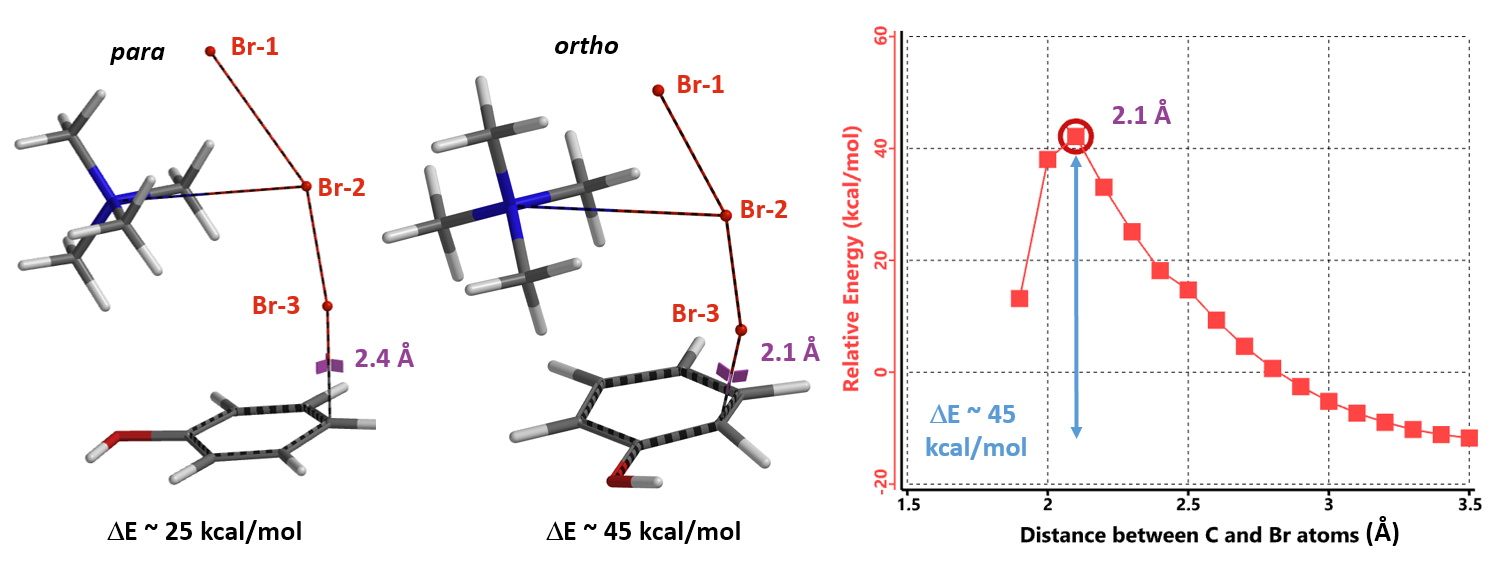
Remarkably, all three calculations found an identical transition structure, suggesting that the connection between TMA+ and tribromide anion is dynamic. Shown on Figure 6 is the Reaction Energy Profile calculated with TMA+ attached to Br-2 and the C – Br-3 distance changing from 3.5 Å to 2.2 Å. At a distance of 2.4 Å, the relative energy reaches a maximum, providing an estimated activation energy of ~ 25 kcal/mol.
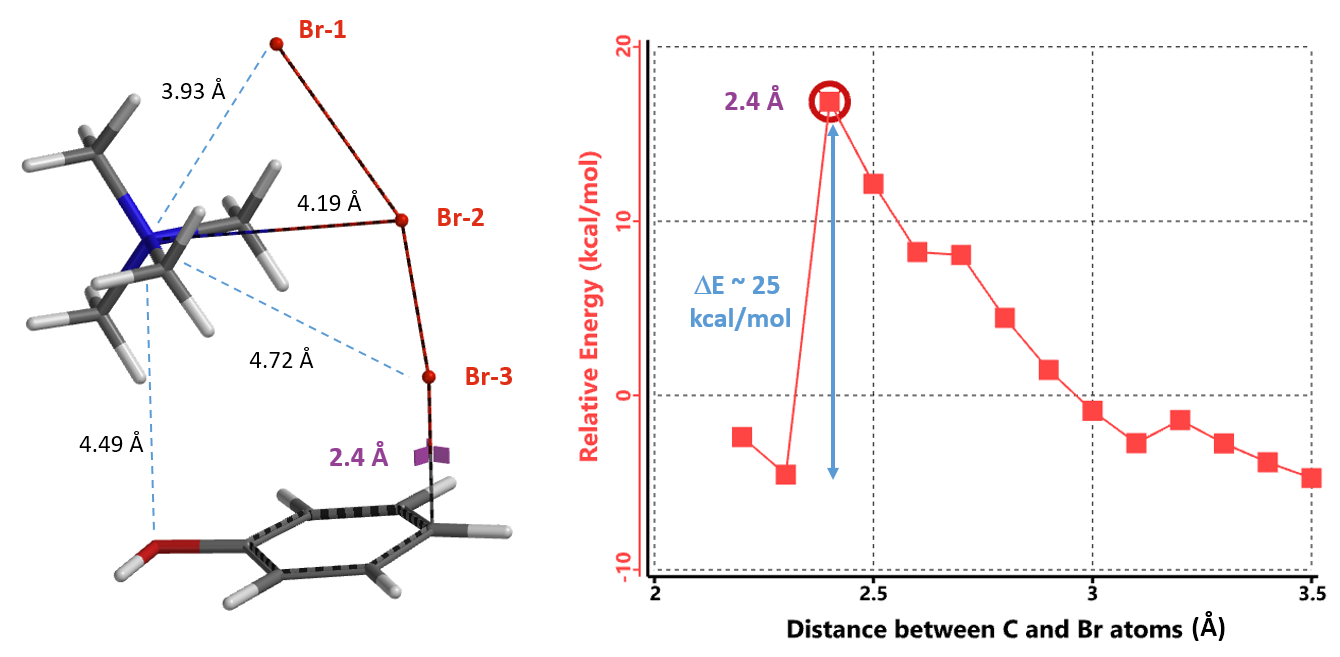
This calculated transition state structure does not involve hydrogen bonding between the phenolic hydrogen and tribromide[2a], and is more consistent with the observation that TBABr3 selectively para brominates N,N-diethylaniline (with no NH proton)[3]. The TMABr3 moiety in the transition state structure (Figure 6) closely resembles the ground state TMABr3 structure modeled (Figure 4, right), supportive of our proposal that the whole TBABr3 entity, not the tribromide anion, is the active brominating species. Furthermore, calculated structure shows that TMA+ is spatially close to the electron-rich phenol oxygen (N-O distance of 4.49 Å), suggestive of an attraction interaction between them, anchoring TMABr3 for its Br-3 to have favorable contact (Figure 6).
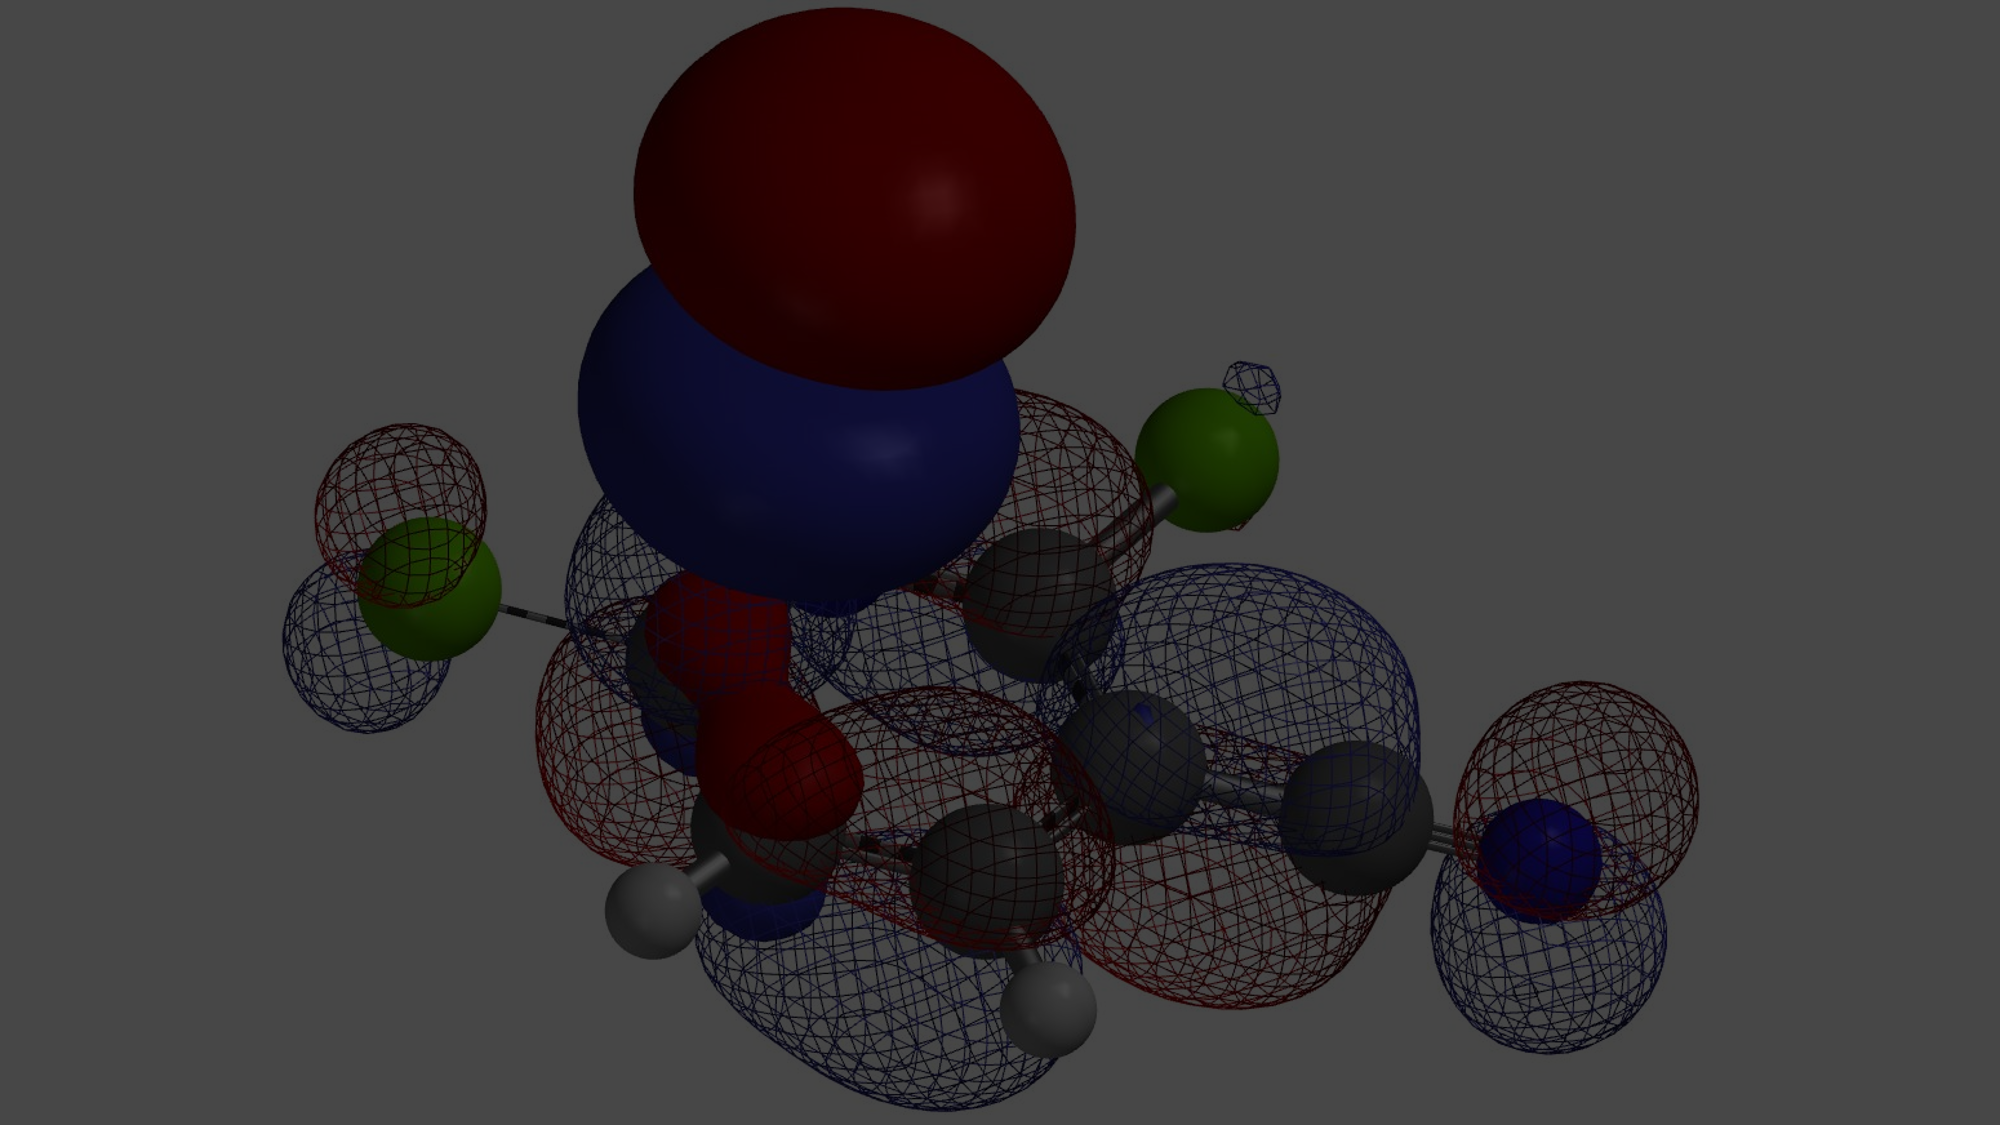
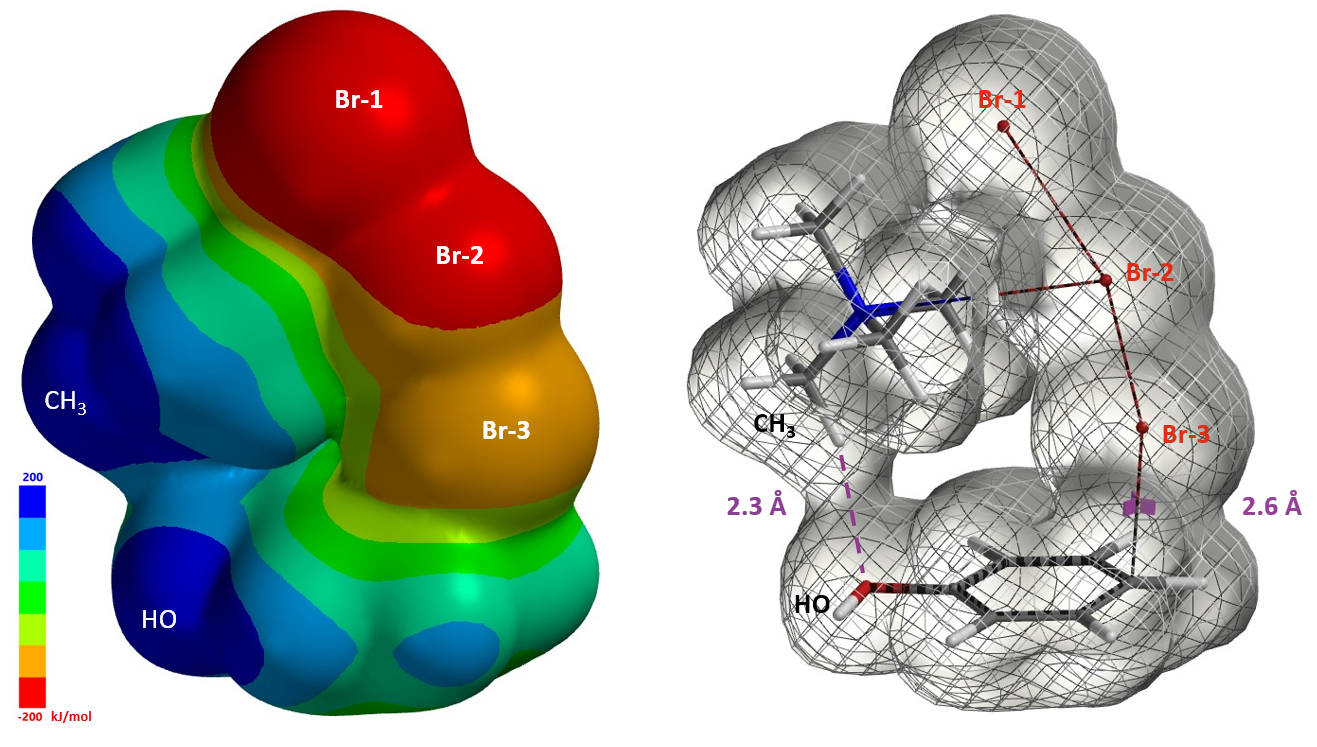
The structures from Reaction Energy Profile calculation also show that Br-3 of TMABr3 is approaching the para carbon at close to 90º angle to the plane of phenol. This enables more optimal orbital interaction, as exemplified with the structures and orbitals in Figure 7, with C – Br-3 distance at 2.6 Å, approaching the transition state (Figure 7).
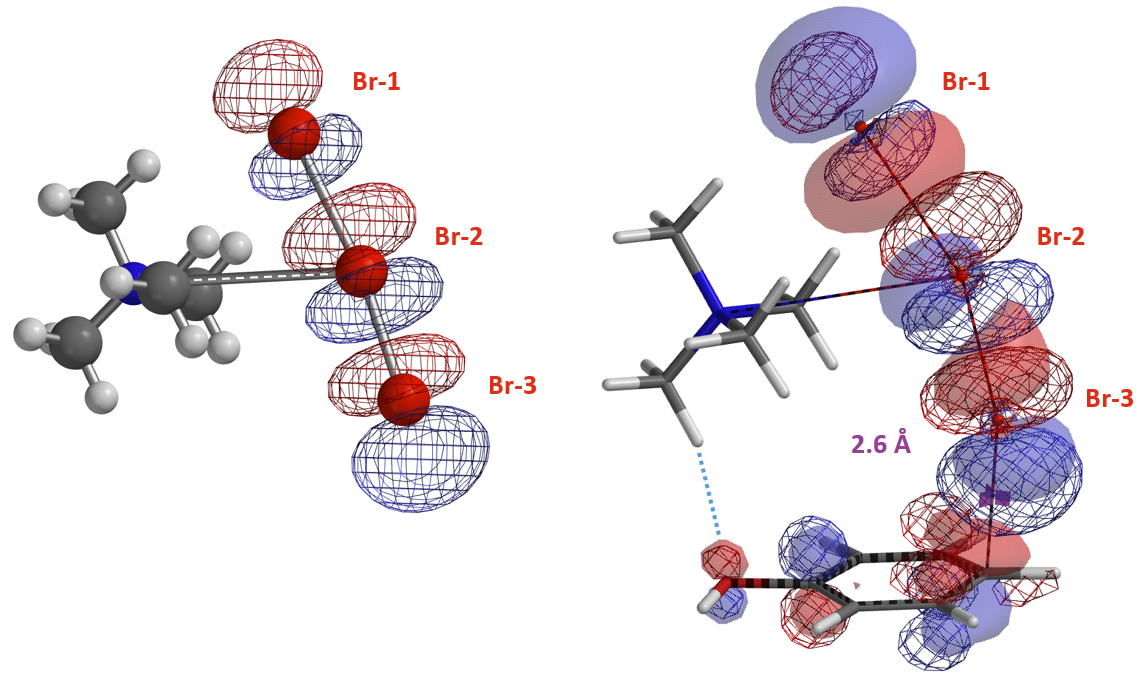
Furthermore the electrostatic potential energy map of the reacting complex at a C – Br-3 distance of 2.6 Å shows that the methyl group on the tetramethylammonium ion is highly electron deficient (Figure 8 left, dark blue)[4]. The electron density map reveals a noncovalent interaction between the hydroxyl oxygen and the hydrogen on the nearest methyl group of TMA+ [5], forming a cyclic TMABr3 – PhOH reacting complex (Figure 8 right), stabilizing the transition state.
Next we calculated for the Reaction Energy Profile of ortho bromination of phenol for comparison (Figure 9). The activation energy of ortho bromination is about 45 kcal/mol, 20 kcal/mol higher than that of the para substitution, accounting for the high para selectivity observed.
In summary, our QM analyses offer an alternative reaction mechanism to account for para selective bromination of phenol with TBABr3. Reaction energy profile calculation suggests that Br-3 in TMABr3 is approaching the para carbon at close to 90º angle to the plane of phenol to enable optimal orbital interaction. The electrostatic potential energy and electron density maps reveal the presence of a non-covalent interaction between phenol oxygen and the hydrogen on the nearest methyl group on TMA+ cation, anchoring the reagent for selective bromination at the para position. Activation energy estimated for ortho bromination reaction is about 20 kcal/mol higher than that of the para bromination, accounting for the high para selectivity observed with TBABr3.
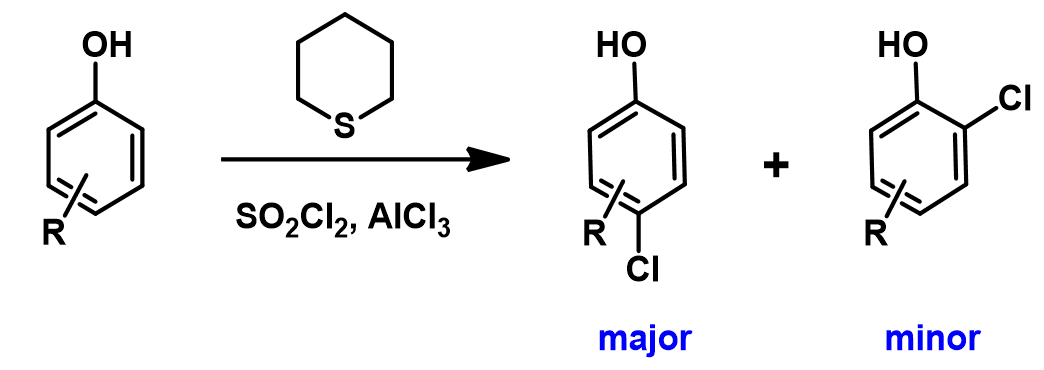
Selective para chlorination of phenols has also been reported[6]. In 2019, El-Hiti et al reported that sulfonyl chloride, in the presence of catalytic amount of tetrahydrothiopyran and AlCl3, chlorinates phenol selectively at the para position (Figure 10)[6e].
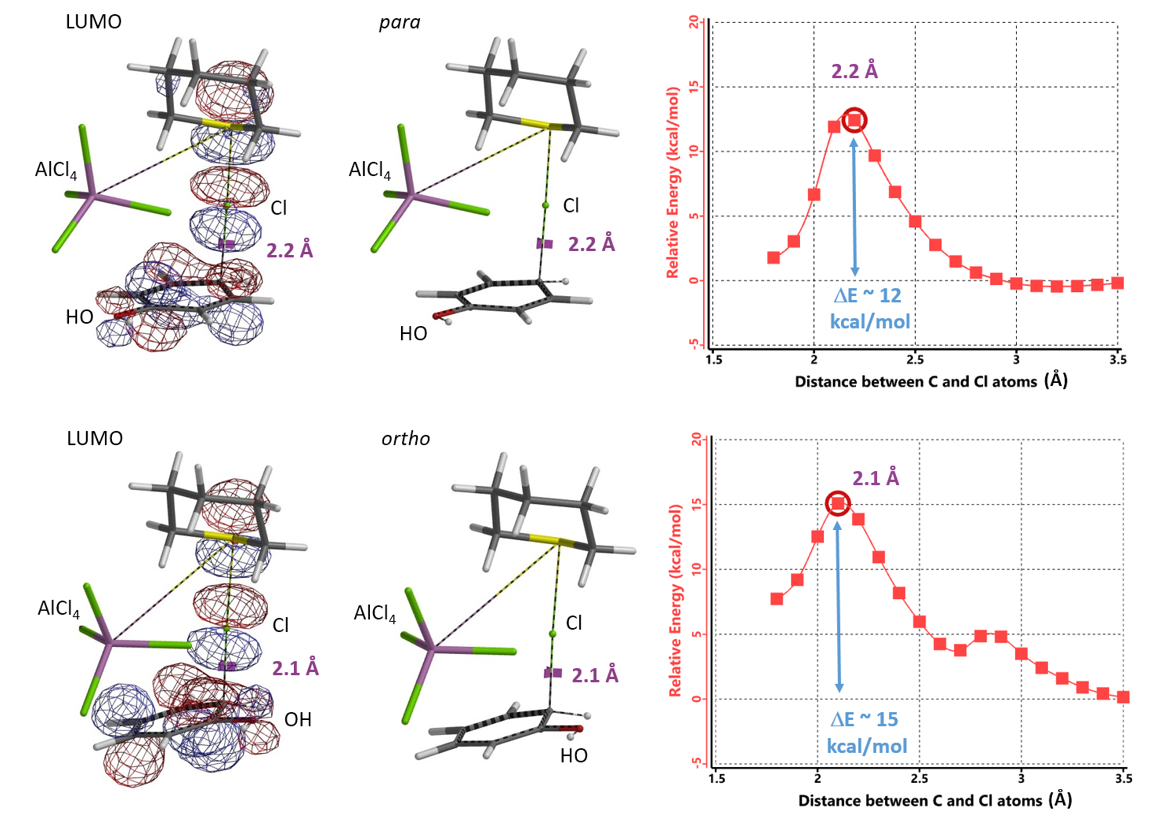
Assuming tetrahydrothiopyran-Cl+ AlCl4- complex to be the chlorinating species, we calculated for the reaction energy profiles for para and ortho substitution, and the LUMO for the resultant transition state structures (Figure 11). We encourage our readers to compare and contrast them with those calculated above with TMABr3.
References:
[1] Macsari, I., Paulsen, K., Rakos, L. etc. Compounds and Their Use for Treatment of Amyloid Beta-Related Diseases: US2012122843, 2012, A1, 50.
[2] (a) 陈中峻. 周克瑜. 四丁基三溴化铵在有机合成中的应用 (Chen, Z., Zhou, K. TBABr3 in Organic Synthesis). University Chemistry 1995, 10, 10. https://doi.org/10.3866/PKU.DXHX19950403 (b) Karmaker, R., Kuotsu, N.B., Ganguly, A., Guchhait, N., Sinha, U. B. Chem. Phys. Lett. 2018, 118. (c) Berthelot, J., Guette, C., Desbene, P.-L., Basselier, J.-J., Chaquin, P., Masure, D. Can. J. Chem. 1990, 68, 464.
[3] Berthelot, J., Guette, C., Essayegh, M., Desbene, P.-L., Basselier, J.-J. Synth. Commun. 1986, 16, 1641.
[4] Application of Electrostatic Potential Map in Acidity Estimation.
[5] Johnson, E.R., Keinan, S., Mori-Sánchez, P., Contreras-García, J., Cohen, A.J., Yang, W.T. J. Am. Chem. Soc. 2010, 132, 6498.
[6] (a) Watson, W. D. J. Org. Chem. 1985, 50, 2145. (b) Maddox, S. M., Dinh, A. N., Armenta, F., Um, J., Gustafson, J. L. Org. Lett. 2016, 21, 5476. (c) Xiong, Y., Duan, H., Meng, X., Ding, Z., Feng, W. J. Chem., 2016, Article ID 2960414. https://doi.org/10.1155/2016/2960414. (d) Jassim. A., Zuhairi, A. J. Kerbala University, 2014, 12, 230. (e) Smith, K., Williams, D., El-Hiti, G. A. J. Sulfur Chem. 2019, 40, 528.
This article is written and edited by Dong Yu, Xiaoli Shen, Tommy Lai, Dong Pan, Yongsheng Chen, and John S. Wai.